Nowcasting Neighborhood Overdose Deaths in LA County
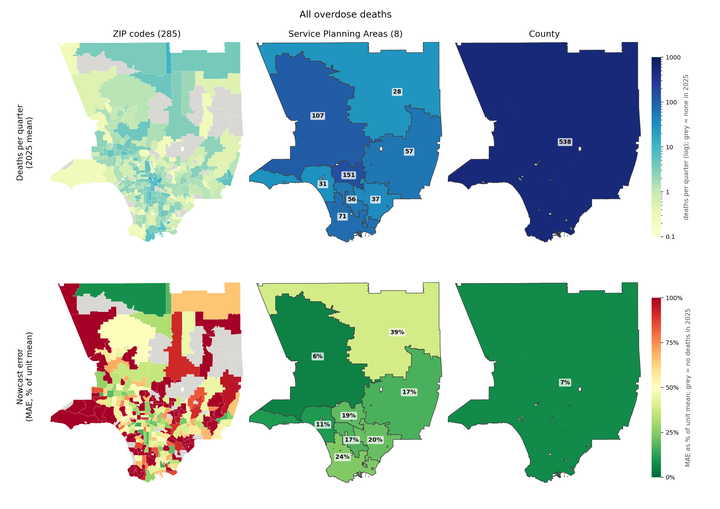 Top: average overdose deaths per quarter in 2025 by ZIP code, Service Planning Area, and county. Bottom: nowcast error at each scale.
Overdose death records take 90–120 days to finalize, so public health teams are always looking at the past. As part of Rapid Overdose Surveillance Los Angeles (ROSLA), this project builds nowcasts of overdose mortality across Los Angeles County ZIP codes to close that gap.
- Models. Gradient-boosted Poisson count models trained in a walk-forward backtest on finalized Medical Examiner records from 2012 to 2025, so every estimate uses only data that would have been available at the time.
- Signals. Each neighborhood’s own overdose history is combined with public data: treatment-facility access, deprivation indices, homeless counts, drug-checking results, EMS calls, and search trends.
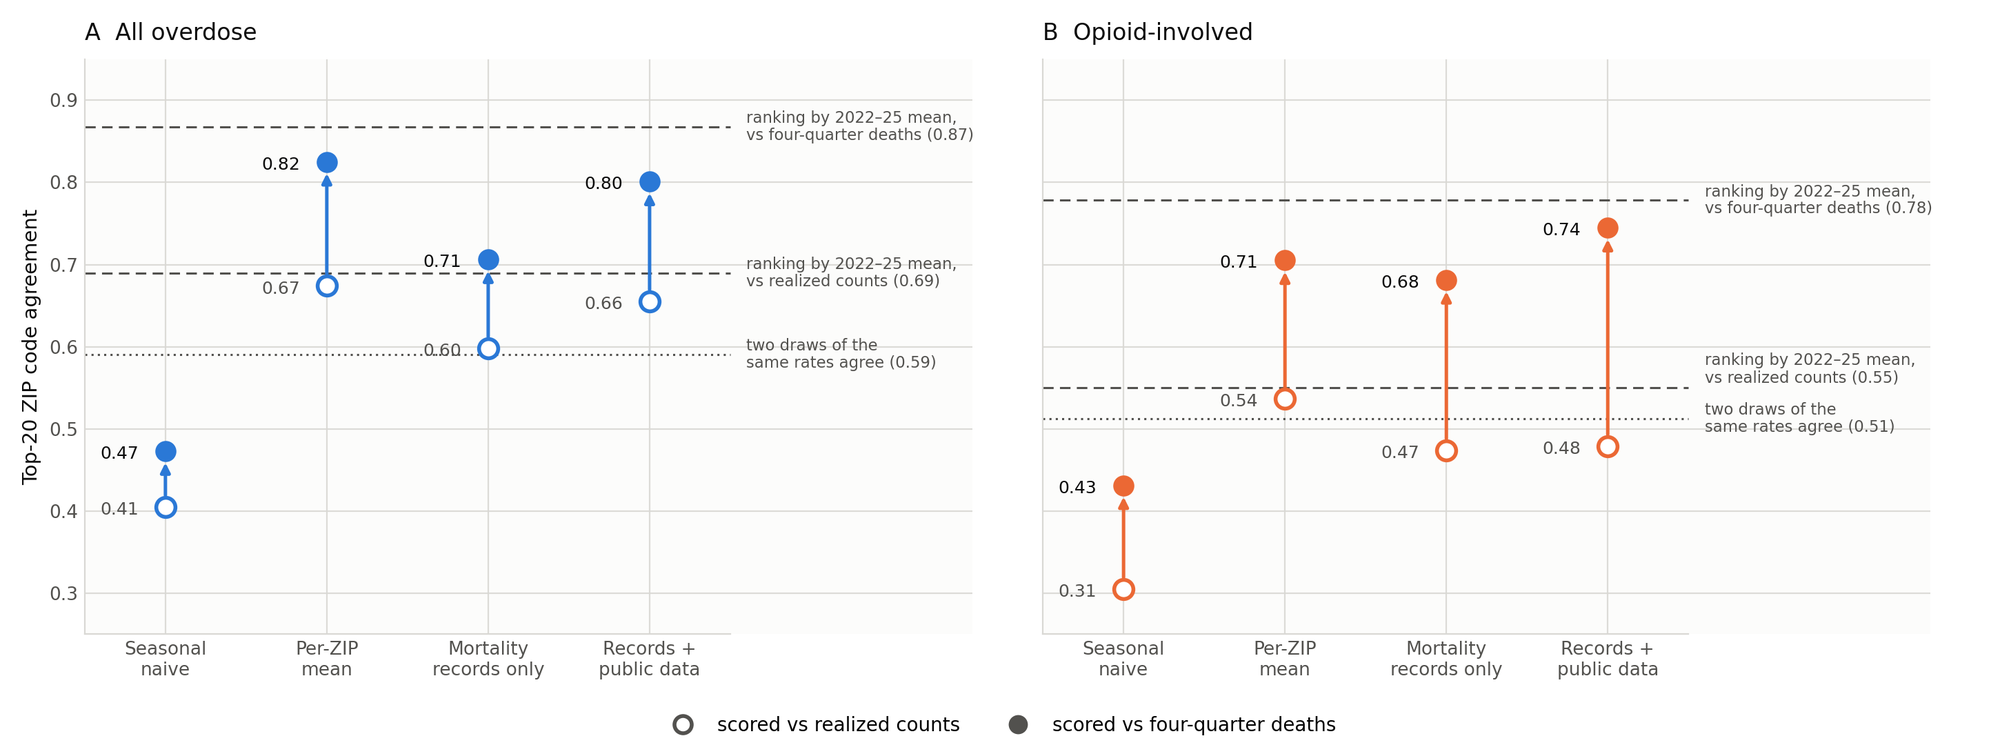
- Knowing what’s knowable. When a ZIP code averages about one death per quarter, random chance dominates. The project measures the ceiling that counting noise places on any model, and uses it to choose the geography and time period where a real rise becomes detectable.
Manuscript in preparation.